
Product Affinity Analysis
Table of Contents
1. Use Cases
Quick links: Make frequently co-shipped products neighbors | Find products to bring closer when picking routes are long
Case 1: Re-plan the picking zone so frequently co-shipped products become neighbors
Situation: Pickers walk around the warehouse all day, and what eats the most time is often not "grabbing items" but "walking." If two products that are frequently bought together sit at opposite ends of the warehouse, every order needing both forces a long detour.
Use this feature: Use Product Affinity Analysis to find product pairs that are "frequently shipped together" (see Two Views), and place the strongly-related products in adjacent locations.
Result: With highly-related products one slot apart, a picker can grab them together in one reach, walking far less each day and speeding up overall shipping.
Case 2: Picking routes keep running long, and you want to find which products to bring closer
Situation: A supervisor notices a certain merchant's orders take unusually long to pick, suspects best-selling items are scattered too far apart, but can't tell from memory exactly which ones should be placed near each other.
Use this feature: Switch to that merchant and sort by Affinity Strength (see Two Key Numbers) to find the high-strength pairs where "buying A almost always means grabbing B."
Result: Using real shipping data instead of guesswork, you pinpoint the few pairs most worth bringing together, and adjusting their locations shortens the picking route.
2. Feature Guide
Product Affinity Analysis scans roughly the past 10 months of shipped orders, counting which products are often bought together on the same order, to help you find "best buddy" product pairs. Its main purpose is slotting — placing frequently co-shipped products in adjacent locations so picking takes fewer wasted steps. The report recalculates automatically every early morning and offers two views: an affinity network graph and a data table.
Jump to: Select a Merchant | Two Key Numbers | Two Views
2.1 Select a Merchant
Affinity analysis is calculated per single merchant. When you serve multiple merchants, first select the merchant to analyze at the top of the page so the report loads that merchant's affinity data; a warehouse serving a single merchant is auto-locked and needs no selection.
2.2 Two Key Numbers
Each related-product pair is tagged with two numbers that mean different things — don't mix them up:
| Number | What it means |
|---|---|
| Co-pick Count | How many times the two products appeared together on the same order; the higher the count, the more they're sold together by volume |
| Affinity Strength | Of the orders that bought product A, what share also bought B (as a percentage); the higher the share, the more reliably buying A also means buying B |
You can switch which number to sort by above the data table.
2.3 Two Views
The same data is presented two ways, depending on whether you want the "overall feel" or "exact numbers":
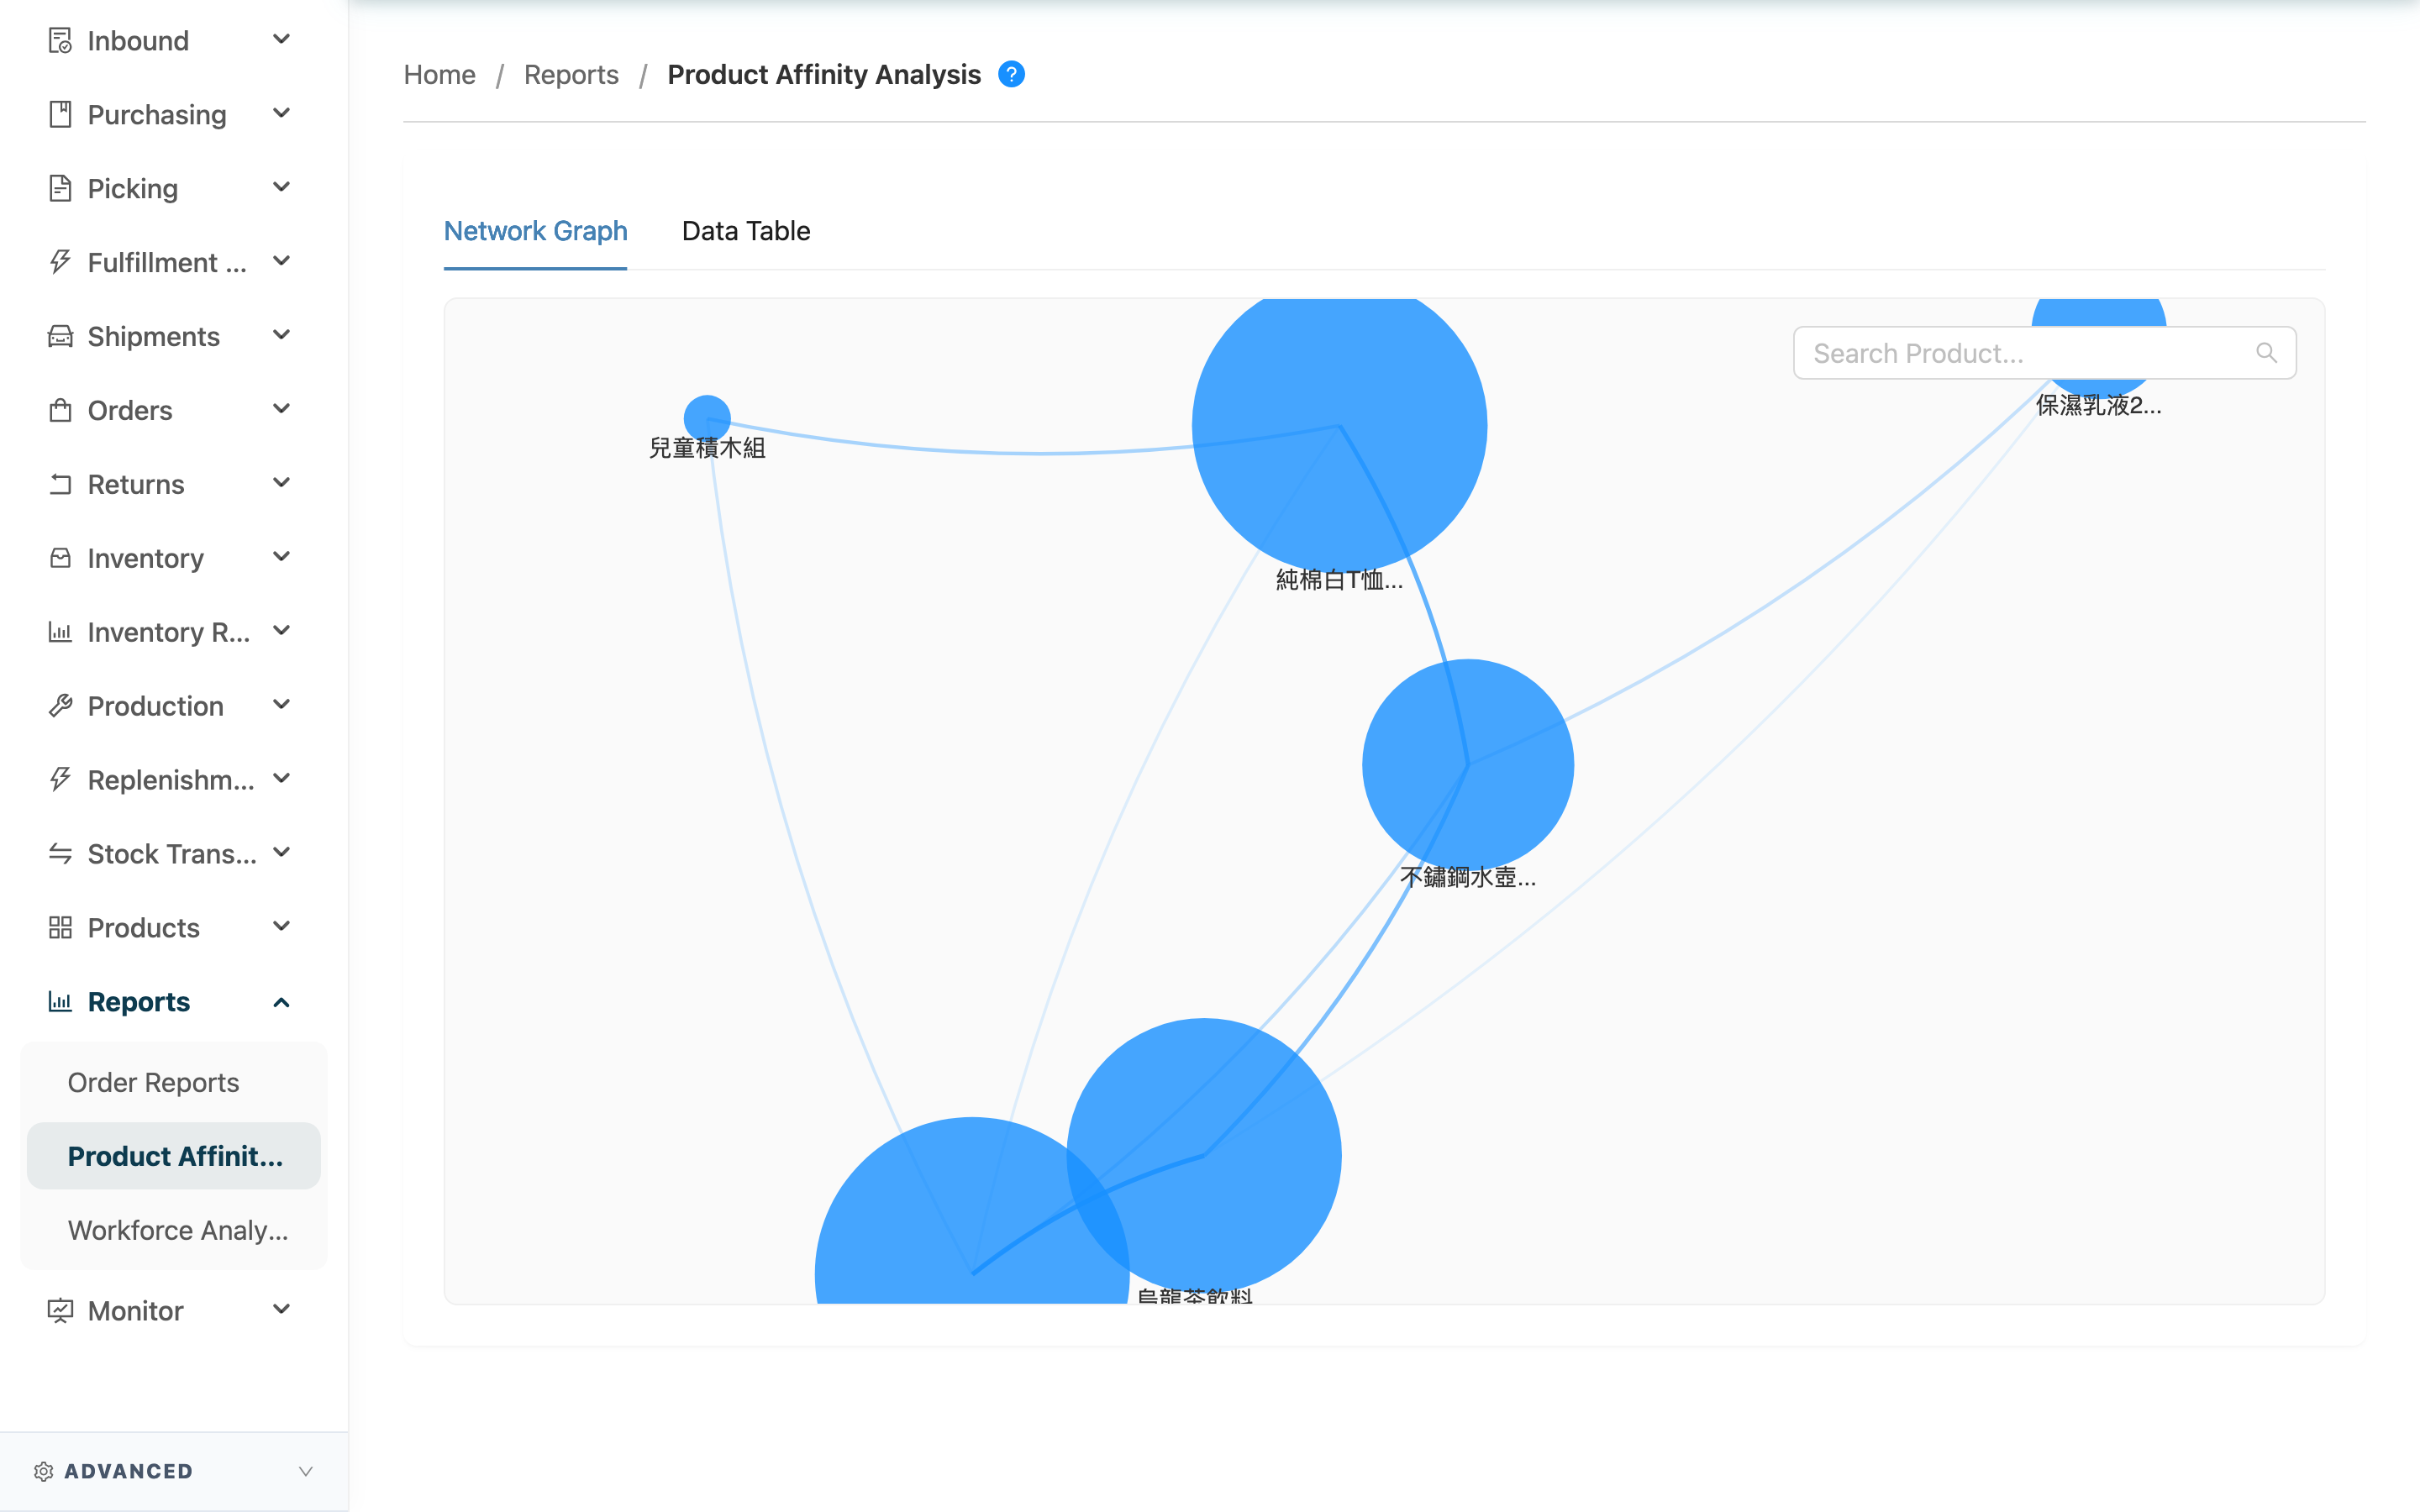
- Network Graph: Each dot is a product, larger dots sell more; the thicker and closer the line between two dots, the stronger the affinity — so you can spot at a glance which clusters of products always stick together.
- Data Table: Each Primary Product lists its top three related products (Most Related, 2nd Related, 3rd Related), each with an affinity-strength bar and co-occurrence count. You can search by product name or SKU and switch sorting by Co-pick Count or Affinity Strength.
3. FAQ
3.1 FAQ
▪ What's the difference between Co-pick Count and Affinity Strength? Which should I look at?
Co-pick Count measures "volume" — how many times the two were bought together; Affinity Strength measures "predictability" — what share of buying A leads to also buying B. To find the pairs "sold together most, most worth re-slotting," look at the co-occurrence count; to find the rock-solid "buy A, almost certainly buy B" pairs, look at affinity strength. See Two Key Numbers.
▪ Why are some products missing from the report?
The system only analyzes the top 200 best-selling products (the Pareto principle — focusing first on what's most often bought together). Cold, low-order, or newly-listed products with few orders won't necessarily appear in the report.
▪ Why isn't a new pairing that started selling well today reflected?
The report recalculates automatically every early morning — it's not real-time. A pairing that only started selling well today won't appear until after the next morning's recalculation.
▪ How long a window of orders does it cover?
Roughly the past 10 months of shipped orders; anything earlier is excluded, so the affinities reflect recent real sales patterns.
▪ Once I've found highly-related products, what's the next step?
Place those pairs in adjacent locations to shorten the picking distance for orders needing both. In addition, the system's location recommendations during putaway also reference this affinity data, placing newly-received goods near related products — see the Inbound List.
3.2 Notes
⚠️ Important
- This is not real-time data: The report recalculates once every early morning; today's new shipments and pairings won't be reflected until the next day.
- Covers only best-sellers and recent orders: It only analyzes the top 200 best-selling products over roughly the past 10 months, so cold or newly-listed products may have no affinity data — don't rely on this report alone when adjusting locations.
💡 Tip: When planning slotting, first sort by Affinity Strength to catch the "buy A, almost certainly buy B" pairs, then use Co-pick Count to confirm the pair's actual shipping volume is large enough to justify moving locations.
4. Related Features
| Feature | Description | Link |
|---|---|---|
| Picking List | Affinity analysis exists to shorten the picking routes here | Go |
| Inbound List | During putaway, the system references product affinity for location suggestions | Go |
| Workforce Analytics | Compare picking-station workforce output | Go |